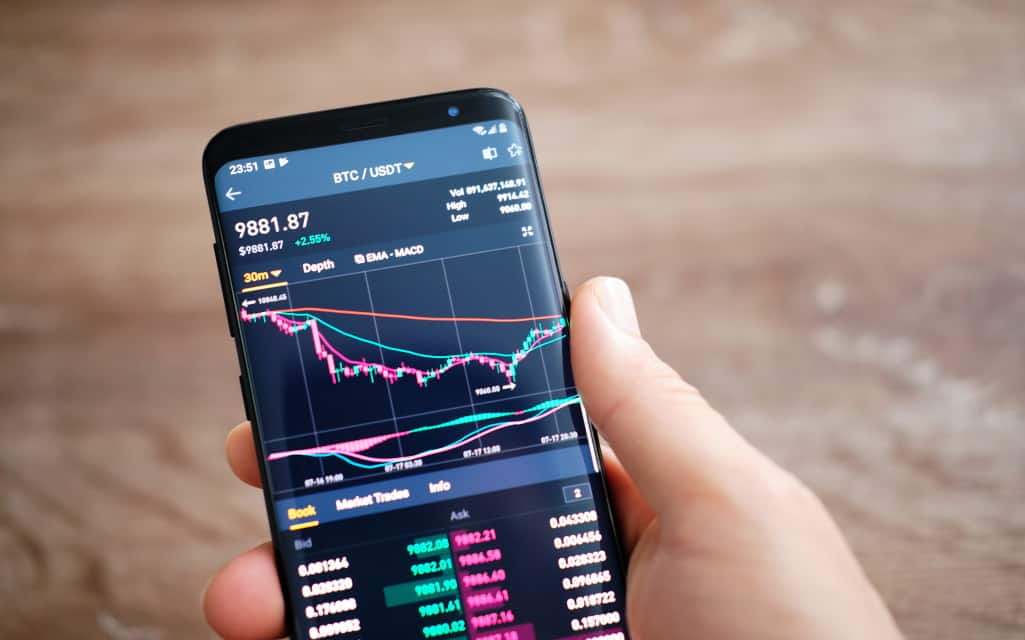
Binary online trading is a method of online investments that one can make at the comfort of their own homes. It is a simple game of guessing. With price boundaries set, it is all about creating an educated guess of whether a stock will hit the upper or lower limit.
In this field of trade, many terms are commonly used to explain specific patterns. In this article, we will talk about the candlestick concept.
What Is The Candlestick Pattern?
It is a technical analysis that shows the varying prices of an asset throughout the day. The use of this pattern originates from Japan, where rice merchants used to track different prices throughout the day to understand the daily momentum.
Today, it is trendy in America and is used by traders to understand price charts.
Hanging Man Candlestick Pattern
One of the types of candlestick pattern is the hanging man pattern. It refers to the shape of the candle and the pattern it represents. It is commonly believed that the hanging man pattern shows a potential downfall to a very successful uptrend. It is valued as a piece of evidence that shows a change in the market.
A hanging man represents that the buyer has lost their strength. It shows that investors think that an asset has peaked its price limit, and it is considered an excellent time to sell the stocks, even though some consider it a risky trade.
Hammer Candlestick Pattern
Another type of candlestick pattern is the hammer candlestick pattern. It’s a pricing chart that occurs when a trade is lower than its starting price. It happens after there has been a price decline.
However, if someone is following the hammer candlestick pattern, they may notice a chance of potential reversal to a higher price instead of a drowning stock.
Read More: Is it Safe to Trade Forex with a Cyprus Brokerage Company?
Difference Between The Two
After learning about the two patterns, one might wonder what it is the difference. There is only one noticeable difference between the hanging man and hammer.
A hanging man pattern is when a stock might potentially lose its value. It is when the stock has reached its maximum price, and there will be no increase.
A hammer pattern is when a stock has already lost its value. But it shows the potential of regaining its importance and showing an uptrend again. Where any traders follow the candlestick pattern, there is no foolproof way of knowing how much of it is true. It is a risky gamble of valuable assets.


